Hi Kevin,
Last week, we discussed, among other things, Acquisition Marketing Efficiency Ratio (aMER) and its marked improvement year-over-year.
That’s not the case anymore. The reason?
The ripple effects of the Silicon Valley Bank run.
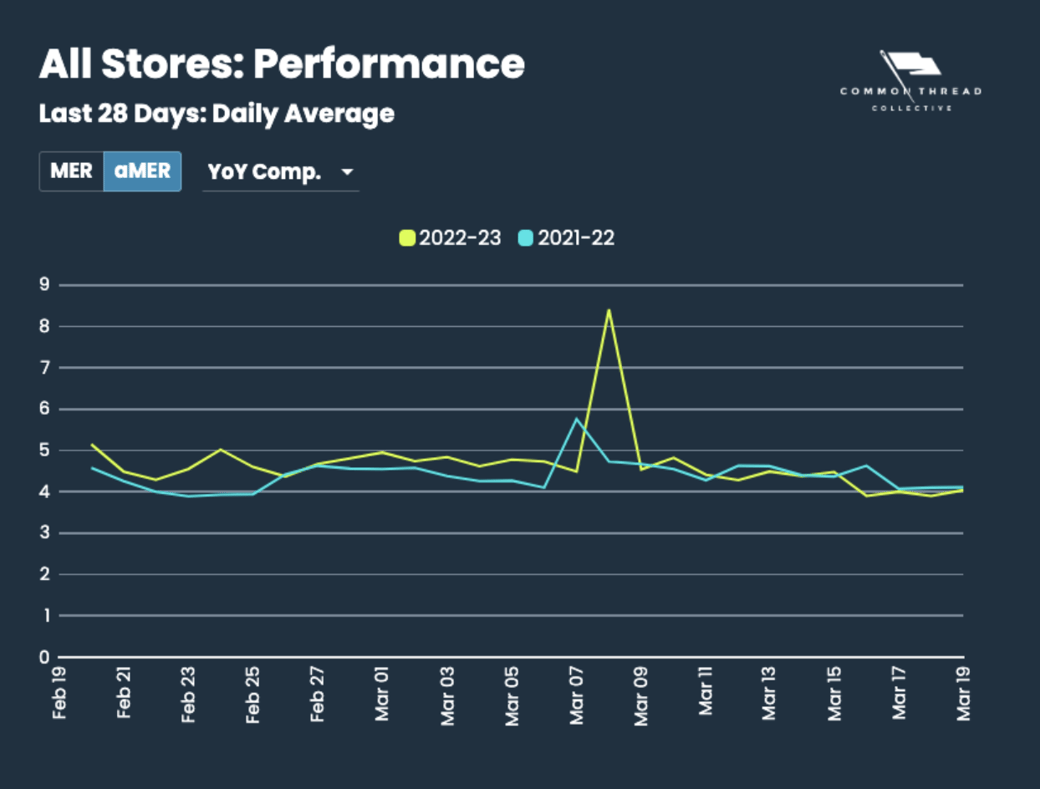
aMER since March 10th is down -2.45% YoY, while aMER in the last 28 days is up, but only by +6.04% (as opposed to +13.45% last week).
But this dip in aMER doesn’t hold true for all brands. In fact, noticeable performance differences appear when we separate brands by their Average Order Value (AOV).
First let’s look at brands with an AOV under $100:
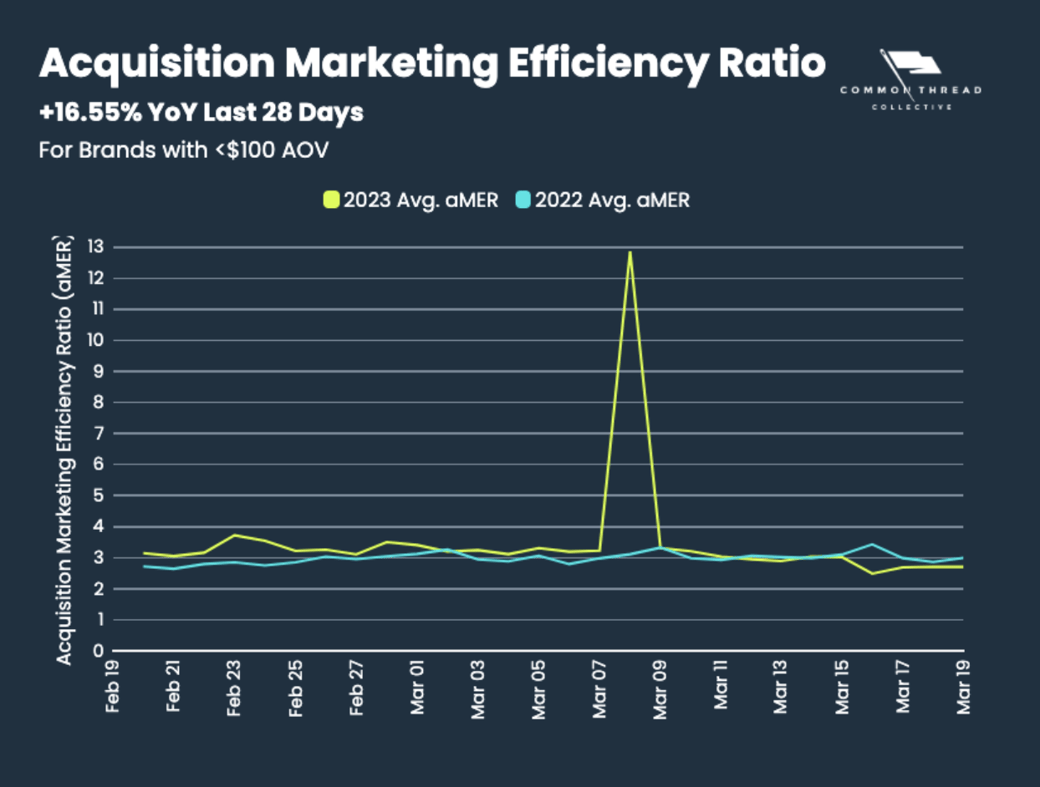
The first thing you’ll notice is the spike on March 8th. That’s International Women’s Day, which many of our brands use as a big promotional event.
More importantly, aMER was trending above last year’s values until around March 10th; since March 10th (when Silicon Valley Bank was taken over by the FDIC), aMER is down -5.39% YoY.
Meanwhile, brands with a $100+ AOV are only down -2.64% since March 10th.
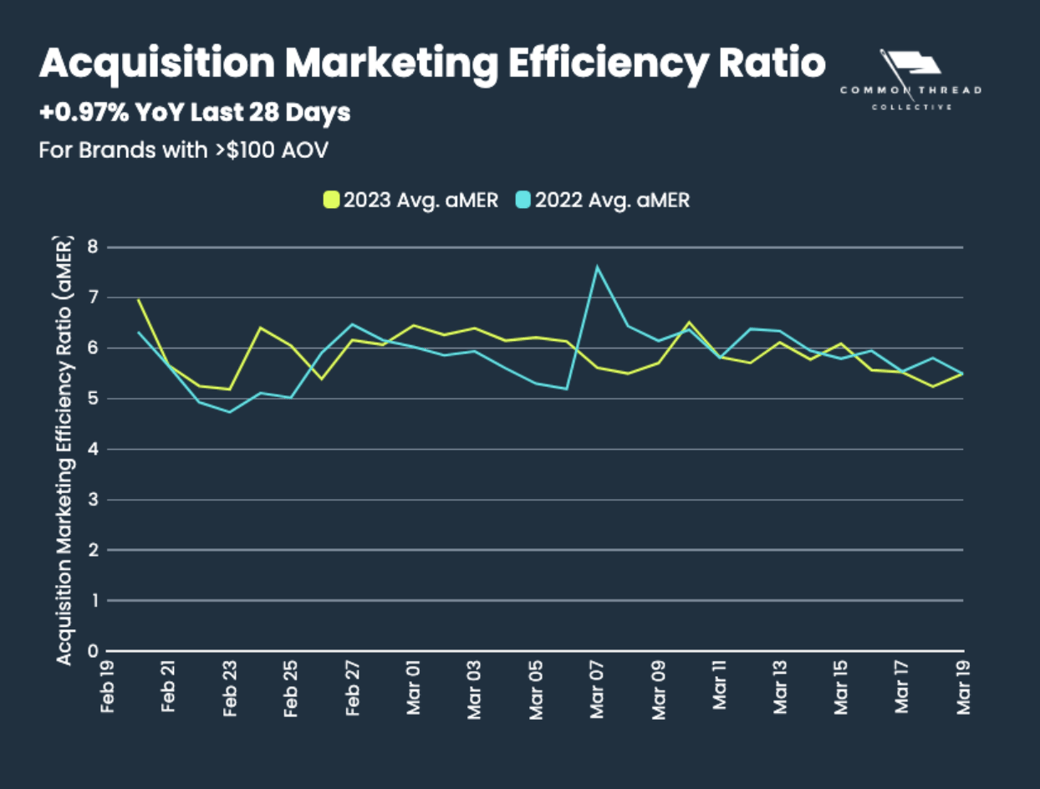
Since aMER looks way better for these brands, you’d think they’d spend more … but they’re not.
Why?
Much like CAC increases with spend, Marginal aMER also degrades with increased spend.
(“Marginal aMER” is the aMER on a spend increase. So if you spent $5,000 on Tuesday and bumped that up to $7,000 on Wednesday, the aMER on that additional $2000 only is your Marginal aMER.)
This degradation becomes noticeable if we plot aMER vs. Spend for this $100+ AOV cohort (after removing 2 outliers, including International Women’s Day):
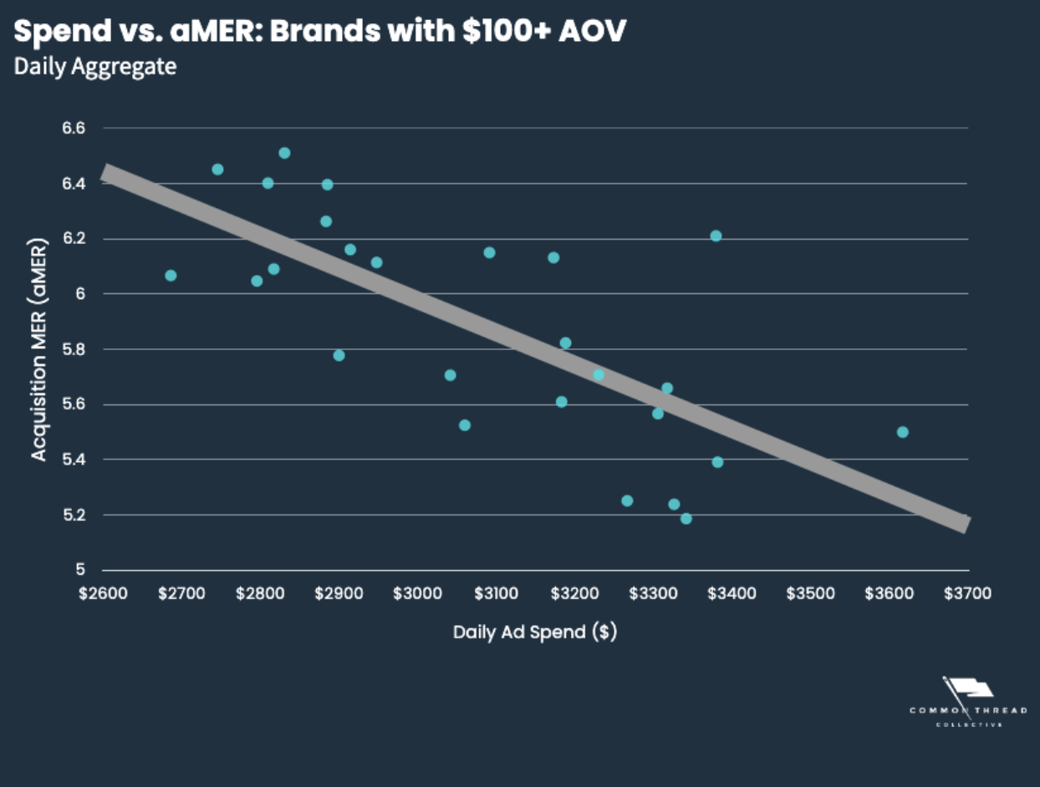
Based on a simple linear regression, aMER decreases by 1 full point for every additional $856 of daily spend.
If we plot the modeled aMER and the modeled Marginal aMER, it becomes clear why brands in this cohort cut off daily spend around $3100 during this month:
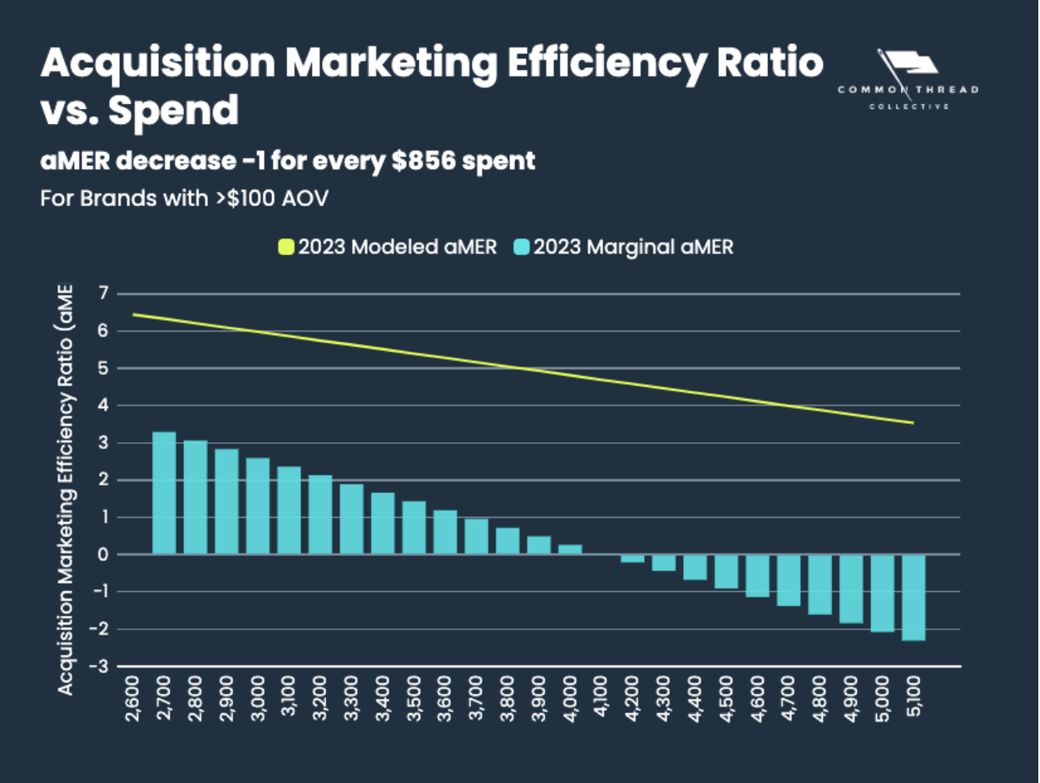
The marginal aMER for this level of spend was 2.36, which is probably around where they need to be to be profitable. Notice that this is 60% less than the modeled aMER of 5.36 for $3100 in daily spend.
That means a brand could look very profitable at 5.36 aMER, but their marginal profitability (for the last $100 they spent in ads) might look barely profitable at a marginal aMER of 2.36.
Moral of the story: A good MER doesn’t necessarily mean “spend more.”
Key Metrics: Last 28 Days Year-over-year
All Stores — Revenue: +10.25%
All Stores — Spend: +9.08%
All Stores — CAC: -5.66%
All Stores — AOV: +2.15%
All Stores — MER: +8.6%
All Stores — aMER: +6.04%
Want more data?
Sign up for the DTC Index to get:
✅ All 27 metrics, including Facebook and Google metrics
✅ The ability to filter data by industry vertical
✅ 28-day and trailing 12-month lookbacks for all metrics |