Hi there,
Over a year after the launch of iOS 14.5 on April 26, 2021, we’re finally comparing apples to apples 🍎
Until now, year-over-year data for Facebook has been marred by an unfair comparison: The pre-iOS days had much better attribution for Facebook revenue and conversions.
On the other hand, the days and weeks post-iOS looked uninspiring at best and bleak at worst.
But that’s not what was really going on.
For the first time, we are beginning to see a true YoY comparison …
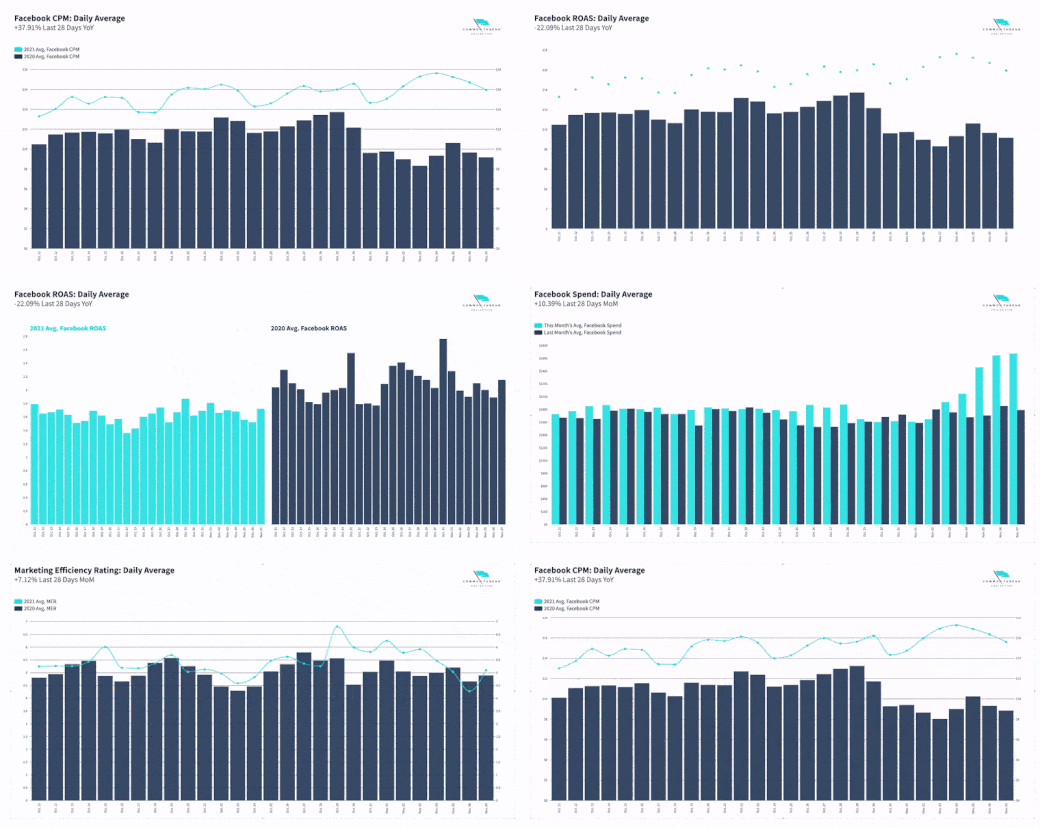
Facebook ROAS is down -1.69% in the last 28-days YoY.
-Jun-16-2022-03-12-13-45-PM.png?upscale=true&width=1040&upscale=true&name=05%20ROAS%2028-Day%20Change%20YoY%20(CTC)-Jun-16-2022-03-12-13-45-PM.png)
In more recent days, however, ROAS is actually higher than in the period following iOS last year.
The same is true for Facebook conversion rates, which decreased -5.87% YoY, but show a few “peaks” above last year throughout the month.
-Jun-16-2022-03-13-16-56-PM.png?upscale=true&width=1040&upscale=true&name=04%20CR%2028-Day%20Change%20YoY%20(CTC)-Jun-16-2022-03-13-16-56-PM.png)
At the same time, Facebook CPMs continue to rise: +21.94% in the last 28 days YoY.
-Jun-16-2022-03-13-42-15-PM.png?upscale=true&width=1040&upscale=true&name=02%20CPM%2028-Day%20Change%20YoY%20(CTC)-Jun-16-2022-03-13-42-15-PM.png)
Brands pulled back on spend to compensate for major gaps in Facebook attribution post-iOS. As a result of less competition, CPMs dropped in May of 2021.
In the end, we are still seeing the effects of data privacy and Facebook revenue attribution. Average Facebook revenue is down -34.87% in the last 28 days YoY.
%20(1).png?upscale=true&width=1040&upscale=true&name=03%20Rev.%2028-Day%20Change%20YoY%20(CTC)%20(1).png)
When Facebook revenue attribution fails, how do you know if you’re really making money?
One of the most important steps you can take to answer this question is to understand your Marketing Efficiency Ratio (MER, or total revenue divided by total ad spend). This number tells you how much you can spend on ads and still make money.
For context, MER declined -4.14% in the last 28 days YoY.
-Jun-16-2022-03-16-04-11-PM.png?upscale=true&width=1040&upscale=true&name=06%20MER%2028-Day%20Change%20YoY%20(CTC)-Jun-16-2022-03-16-04-11-PM.png)
Ecommerce revenue is also down, but not by much: -1.30% in the last 28 days YoY.
-Jun-16-2022-03-18-07-45-PM.png?upscale=true&width=1040&upscale=true&name=09%20Rev.%20Total%2028-Day%20Change%20YoY%20(CTC)-Jun-16-2022-03-18-07-45-PM.png)
While Facebook revenue attribution continues to be an unreliable metric, MER and overall ecommerce revenue are much less affected.
The low decrease in YoY MER means that compared to last year, brands are relatively stable when it comes to measuring every dollar spent against every incoming dollar.
Plus, relatively stable YoY revenue shows efficiency across all channels is maintained.
Ultimately, these post-iOS YoY metrics reveal how essential it is to understand the full financial picture of your business, without focusing on a single-channel metric like Facebook revenue.
View the rest of the 28-day YoY and MoM charts for more post-iOS YoY insights …
Get the Data ⤵️
PW: StatlasEcommerceData!
Happy scaling,
CTC’s entire team 🏁
Set your business on a path to growth with more insights like these …
Build your custom, year-long growth plan featuring a full-year marketing calendar, spend and budget plan, and four months of Statlas.
Plus, sit down with our team of experts for a personalized consultation. |